United States's Iron Ores and Concentrates Market to Reach 61M Tons and $7B by 2035
Market Forecast
Driven by increasing demand for iron ores and concentrates in the United States, the market is expected to continue an upward consumption trend over the next decade. Market performance is forecast to accelerate, expanding with an anticipated CAGR of +2.1% for the period from 2024 to 2035, which is projected to bring the market volume to 61M tons by the end of 2035.
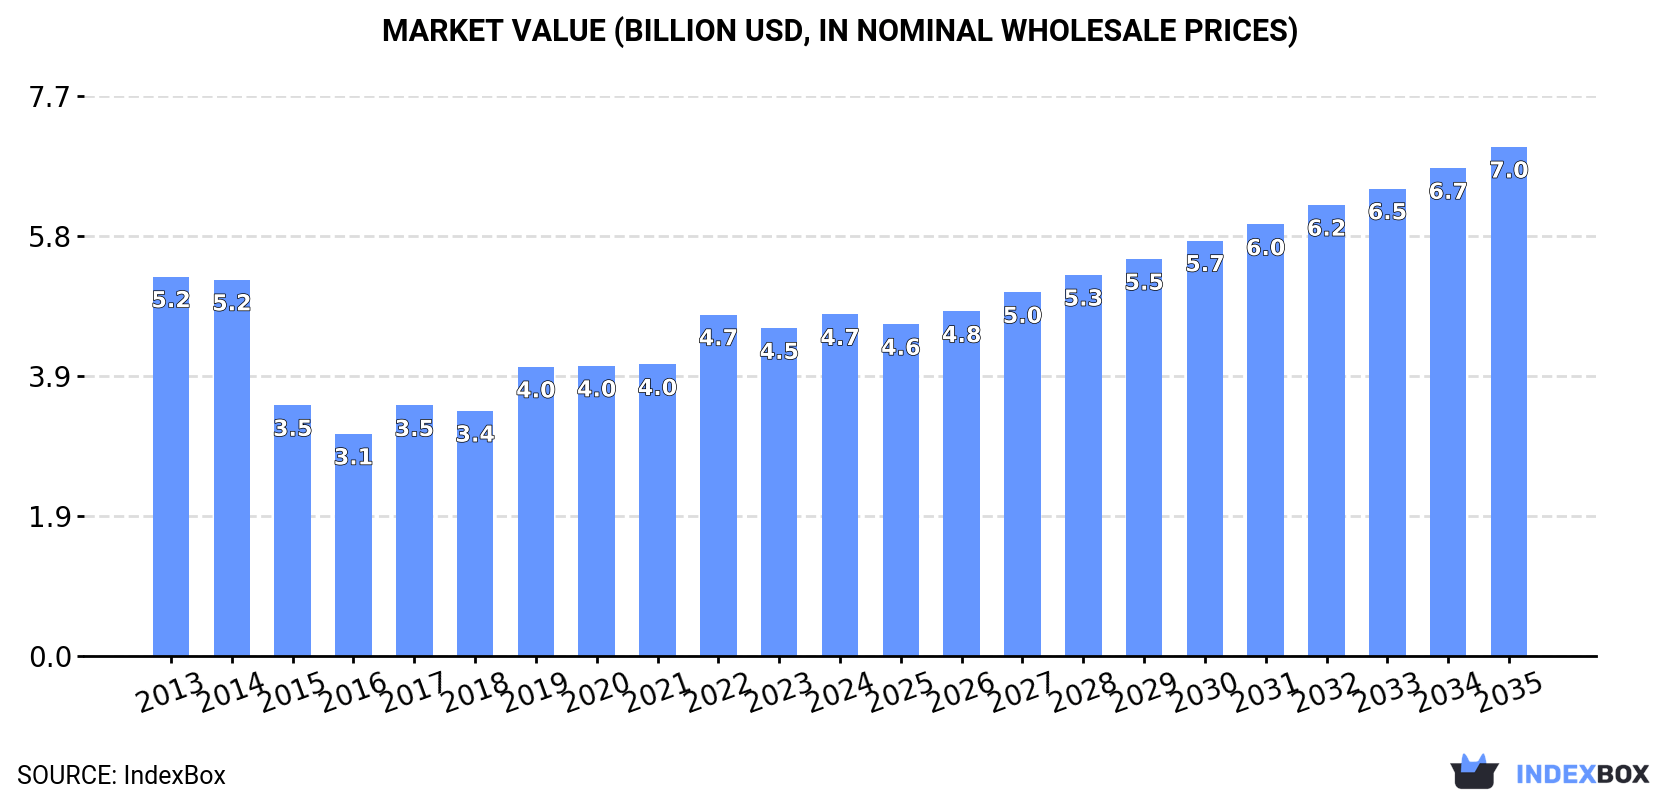
In value terms, the market is forecast to increase with an anticipated CAGR of +3.7% for the period from 2024 to 2035, which is projected to bring the market value to $7B (in nominal wholesale prices) by the end of 2035.
Consumption
United States's Consumption of Iron Ores And Concentrates
In 2024, the amount of iron ores and concentrates consumed in the United States stood at 49M tons, increasing by 2.6% compared with the previous year. Over the period under review, consumption continues to indicate a relatively flat trend pattern. The pace of growth appeared the most rapid in 2022 with an increase of 9.8% against the previous year. Over the period under review, consumption attained the peak volume in 2024 and is expected to retain growth in the immediate term.
The value of the iron ore market in the United States rose modestly to $4.7B in 2024, with an increase of 4.2% against the previous year. This figure reflects the total revenues of producers and importers (excluding logistics costs, retail marketing costs, and retailers' margins, which will be included in the final consumer price). Overall, consumption, however, recorded a relatively flat trend pattern. Over the period under review, the market hit record highs at $5.2B in 2013; however, from 2014 to 2024, consumption remained at a lower figure.
Production
United States's Production of Iron Ores And Concentrates
In 2024, the amount of iron ores and concentrates produced in the United States amounted to 54M tons, remaining constant against the previous year's figure. Overall, production recorded a relatively flat trend pattern. The pace of growth was the most pronounced in 2014 with an increase of 4.4%. As a result, production reached the peak volume of 54M tons. From 2015 to 2024, production growth remained at a lower figure.
In value terms, iron ore production rose slightly to $5.2B in 2024. Over the period under review, production, however, continues to indicate a mild descent. The growth pace was the most rapid in 2019 with an increase of 14%. Iron ore production peaked at $6.5B in 2013; however, from 2014 to 2024, production failed to regain momentum.
Imports
United States's Imports of Iron Ores And Concentrates
In 2024, iron ore imports into the United States declined slightly to 4.9M tons, with a decrease of -4% compared with the previous year's figure. Over the period under review, total imports indicated a noticeable expansion from 2013 to 2024: its volume increased at an average annual rate of +3.8% over the last eleven years. The trend pattern, however, indicated some noticeable fluctuations being recorded throughout the analyzed period. Based on 2024 figures, imports decreased by -22.9% against 2017 indices. The most prominent rate of growth was recorded in 2017 with an increase of 107%. As a result, imports reached the peak of 6.4M tons. From 2018 to 2024, the growth of imports remained at a somewhat lower figure.
In value terms, iron ore imports dropped to $761M in 2024. Overall, imports, however, showed a moderate increase. The pace of growth was the most pronounced in 2017 when imports increased by 152%. Over the period under review, imports attained the maximum at $1.1B in 2021; however, from 2022 to 2024, imports failed to regain momentum.
Imports By Country
Brazil (2.4M tons), Canada (1.8M tons) and Sweden (162K tons) were the main suppliers of iron ore imports to the United States, with a combined 88% share of total imports.
From 2013 to 2024, the biggest increases were recorded for Brazil (with a CAGR of +12.9%), while purchases for the other leaders experienced more modest paces of growth.
In value terms, Brazil ($401M), Canada ($285M) and Sweden ($25M) appeared to be the largest iron ore suppliers to the United States, together accounting for 93% of total imports.
Brazil, with a CAGR of +15.8%, saw the highest growth rate of the value of imports, among the main suppliers over the period under review, while purchases for the other leaders experienced more modest paces of growth.
Imports By Type
In 2024, iron ores and concentrates, agglomerated (excluding roasted iron pyrites) (4.5M tons) was the main type of iron ores and concentrates supplied to the United States, with a 92% share of total imports. Moreover, iron ores and concentrates, agglomerated (excluding roasted iron pyrites) exceeded the figures recorded for the second-largest type, iron ores and concentrates, non-agglomerated (378K tons), more than tenfold.
From 2013 to 2024, the average annual growth rate of the volume of iron ores and concentrates, agglomerated (excluding roasted iron pyrites) imports totaled +7.4%.
In value terms, iron ores and concentrates, agglomerated (excluding roasted iron pyrites) ($720M) constituted the largest type of iron ores and concentrates supplied to the United States, comprising 95% of total imports. The second position in the ranking was held by iron ores and concentrates, non-agglomerated ($41M), with a 5.4% share of total imports.
From 2013 to 2024, the average annual rate of growth in terms of the value of iron ores and concentrates, agglomerated (excluding roasted iron pyrites) imports amounted to +8.2%.
Import Prices By Type
In 2024, the average iron ore import price amounted to $155 per ton, declining by -3.3% against the previous year. Over the period under review, the import price, however, continues to indicate a relatively flat trend pattern. The growth pace was the most rapid in 2021 when the average import price increased by 73%. As a result, import price reached the peak level of $207 per ton. From 2022 to 2024, the average import prices remained at a lower figure.
Average prices varied somewhat amongst the major supplied products. In 2024, the product with the highest price was iron ores and concentrates, agglomerated (excluding roasted iron pyrites) ($159 per ton), while the price for iron ores and concentrates, non-agglomerated totaled $108 per ton.
From 2013 to 2024, the most notable rate of growth in terms of prices was attained by iron ore and concentrate, agglomerated (excluding roasted iron pyrites) (+0.7%).
Import Prices By Country
In 2024, the average iron ore import price amounted to $155 per ton, falling by -3.3% against the previous year. Over the period under review, the import price, however, showed a relatively flat trend pattern. The most prominent rate of growth was recorded in 2021 an increase of 73% against the previous year. As a result, import price attained the peak level of $207 per ton. From 2022 to 2024, the average import prices remained at a somewhat lower figure.
Prices varied noticeably by country of origin: amid the top importers, the country with the highest price was Brazil ($168 per ton), while the price for South Africa ($107 per ton) was amongst the lowest.
From 2013 to 2024, the most notable rate of growth in terms of prices was attained by Brazil (+2.6%), while the prices for the other major suppliers experienced more modest paces of growth.
Exports
United States's Exports of Iron Ores And Concentrates
In 2024, the amount of iron ores and concentrates exported from the United States dropped to 10M tons, falling by -8.9% against the previous year. Overall, exports showed a relatively flat trend pattern. The most prominent rate of growth was recorded in 2021 with an increase of 38%. As a result, the exports attained the peak of 14M tons. From 2022 to 2024, the growth of the exports remained at a somewhat lower figure.
In value terms, iron ore exports reduced to $1.1B in 2024. In general, exports showed a pronounced slump. The pace of growth appeared the most rapid in 2021 when exports increased by 52%. The exports peaked at $1.5B in 2013; however, from 2014 to 2024, the exports stood at a somewhat lower figure.
Exports By Country
Canada (7.5M tons) was the main destination for iron ore exports from the United States, with a 73% share of total exports. Moreover, iron ore exports to Canada exceeded the volume sent to the second major destination, China (1.2M tons), sixfold. The Netherlands (276K tons) ranked third in terms of total exports with a 2.7% share.
From 2013 to 2024, the average annual rate of growth in terms of volume to Canada stood at +1.9%. Exports to the other major destinations recorded the following average annual rates of exports growth: China (-7.2% per year) and the Netherlands (+125.5% per year).
In value terms, Canada ($751M) remains the key foreign market for iron ores and concentrates exports from the United States, comprising 71% of total exports. The second position in the ranking was taken by China ($135M), with a 13% share of total exports. It was followed by the Netherlands, with a 3.5% share.
From 2013 to 2024, the average annual rate of growth in terms of value to Canada stood at -1.6%. Exports to the other major destinations recorded the following average annual rates of exports growth: China (-8.3% per year) and the Netherlands (+136.4% per year).
Exports By Type
Iron ores and concentrates, agglomerated (excluding roasted iron pyrites) (8.7M tons) was the largest type of iron ores and concentrates exported from the United States, with a 85% share of total exports. Moreover, iron ores and concentrates, agglomerated (excluding roasted iron pyrites) exceeded the volume of the second product type, iron ores and concentrates, non-agglomerated (1.5M tons), sixfold.
From 2013 to 2024, the average annual growth rate of the volume of iron ores and concentrates, agglomerated (excluding roasted iron pyrites) exports was relatively modest.
In value terms, iron ores and concentrates, agglomerated (excluding roasted iron pyrites) ($857M) remains the largest type of iron ores and concentrates exported from the United States, comprising 81% of total exports. The second position in the ranking was held by iron ores and concentrates, non-agglomerated ($203M), with a 19% share of total exports.
From 2013 to 2024, the average annual growth rate of the value of iron ores and concentrates, agglomerated (excluding roasted iron pyrites) exports amounted to -2.5%.
Export Prices By Type
In 2024, the average iron ore export price amounted to $104 per ton, growing by 4.2% against the previous year. Overall, the export price, however, saw a noticeable downturn. The growth pace was the most rapid in 2019 an increase of 16%. The export price peaked at $134 per ton in 2013; however, from 2014 to 2024, the export prices remained at a lower figure.
Average prices varied somewhat for the major types of exported product. In 2024, the product with the highest price was iron ores and concentrates, non-agglomerated ($133 per ton), while the average price for exports of iron ores and concentrates, agglomerated (excluding roasted iron pyrites) amounted to $99 per ton.
From 2013 to 2024, the most notable rate of growth in terms of prices was recorded for the following types: iron ore and concentrate, non-agglomerated (+1.2%).
Export Prices By Country
In 2024, the average iron ore export price amounted to $104 per ton, increasing by 4.2% against the previous year. Overall, the export price, however, recorded a noticeable setback. The most prominent rate of growth was recorded in 2019 an increase of 16% against the previous year. The export price peaked at $134 per ton in 2013; however, from 2014 to 2024, the export prices stood at a somewhat lower figure.
Prices varied noticeably by country of destination: amid the top suppliers, the country with the highest price was Mexico ($401 per ton), while the average price for exports to Spain ($58 per ton) was amongst the lowest.
From 2013 to 2024, the most notable rate of growth in terms of prices was recorded for supplies to Mexico (+13.7%), while the prices for the other major destinations experienced more modest paces of growth.
Originally published on INDEXBOX


![Metals Rise Across the Board, with SHFE Nickel Up Nearly 2%; Stainless Steel, SHFE Lead, and SHFE Aluminum Lead Gains; Iron Ore Up Over 2% [SMM Midday Review]](/_next/image?url=https%3A%2F%2Fapi.infrakeys.com%2Fpublic%2Fimages%2F1747029799473_news_36.webp&w=256&q=75)































.webp&w=256&q=75)


.jpg&w=256&q=75)









.webp&w=256&q=75)