Global Stainless Steel Sinks and Wash Basins Market Expected to Witness 2.8% CAGR Growth from 2024 to 2035
Market Forecast
Driven by increasing demand for stainless steel sinks and wash basins worldwide, the market is expected to continue an upward consumption trend over the next decade. Market performance is forecast to accelerate, expanding with an anticipated CAGR of +2.8% for the period from 2024 to 2035, which is projected to bring the market volume to 366M units by the end of 2035.
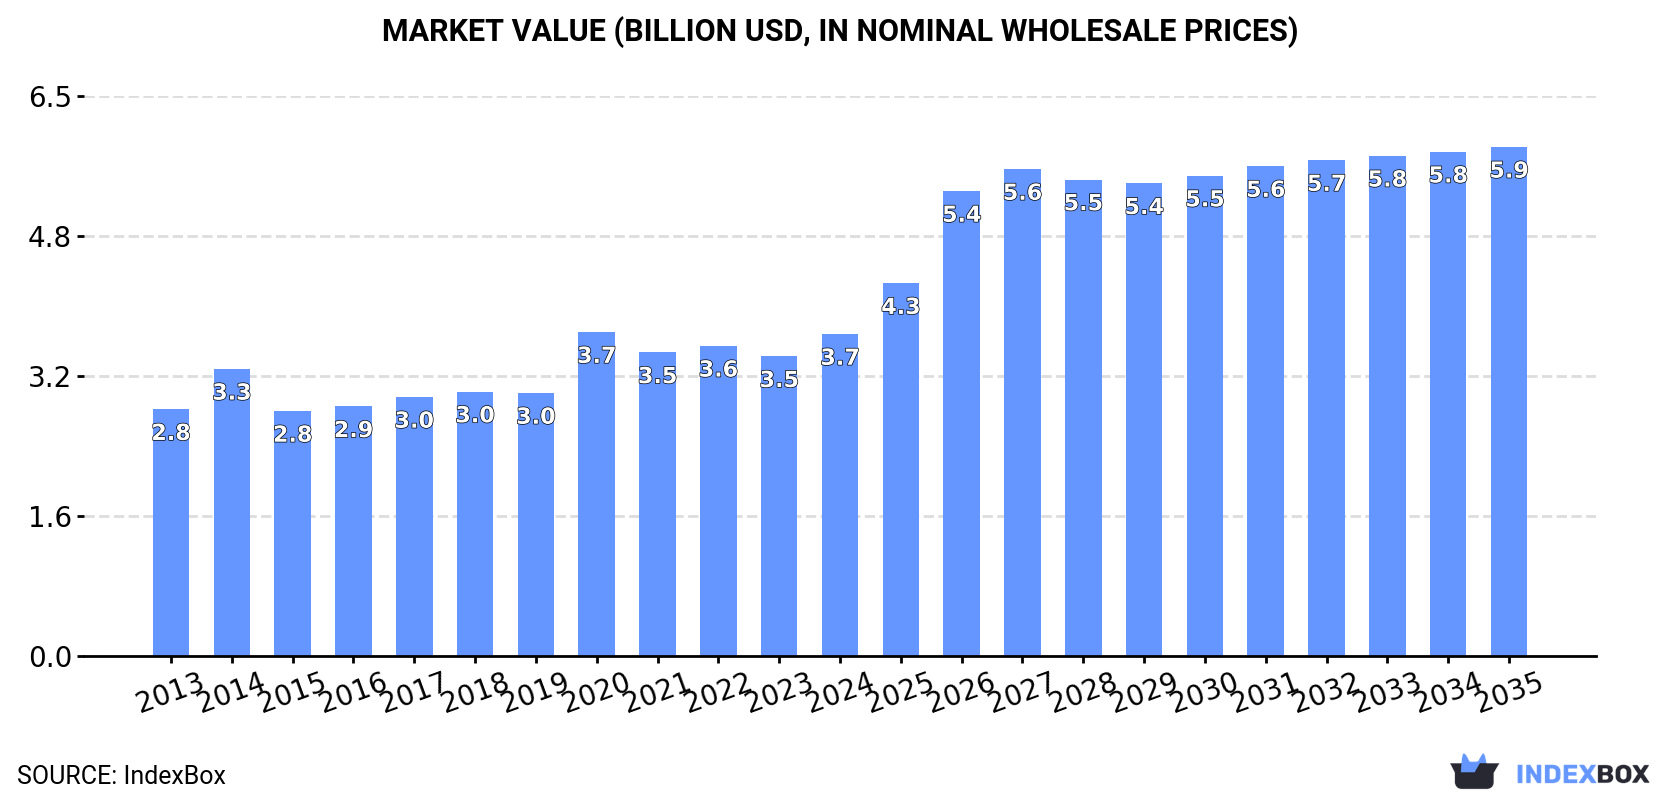
In value terms, the market is forecast to increase with an anticipated CAGR of +4.3% for the period from 2024 to 2035, which is projected to bring the market value to $5.9B (in nominal wholesale prices) by the end of 2035.
Consumption
World's Consumption of Stainless Steel Sinks And Wash Basins
Global stainless steel sink consumption totaled 270M units in 2024, picking up by 4.5% against the previous year. In general, consumption recorded a relatively flat trend pattern. As a result, consumption reached the peak volume of 350M units. From 2015 to 2024, the growth of the global consumption remained at a somewhat lower figure.
The global stainless steel sink market value rose remarkably to $3.7B in 2024, picking up by 7.4% against the previous year. This figure reflects the total revenues of producers and importers (excluding logistics costs, retail marketing costs, and retailers' margins, which will be included in the final consumer price). The market value increased at an average annual rate of +2.4% from 2013 to 2024; the trend pattern indicated some noticeable fluctuations being recorded in certain years. As a result, consumption attained the peak level of $3.7B; afterwards, it flattened through to 2024.
Consumption By Country
The countries with the highest volumes of consumption in 2024 were China (53M units), Russia (30M units) and the United States (25M units), together comprising 40% of global consumption. India, Japan, Pakistan, Brazil, Germany, the Philippines and Mexico lagged somewhat behind, together comprising a further 22%.
From 2013 to 2024, the biggest increases were recorded for the Philippines (with a CAGR of +9.1%), while consumption for the other global leaders experienced more modest paces of growth.
In value terms, China ($971M) led the market, alone. The second position in the ranking was held by the United States ($449M). It was followed by Germany.
From 2013 to 2024, the average annual rate of growth in terms of value in China totaled +2.3%. The remaining consuming countries recorded the following average annual rates of market growth: the United States (+4.6% per year) and Germany (+9.7% per year).
In 2024, the highest levels of stainless steel sink per capita consumption was registered in Russia (210 units per 1000 persons), followed by the United States (73 units per 1000 persons), Japan (70 units per 1000 persons) and Germany (69 units per 1000 persons), while the world average per capita consumption of stainless steel sink was estimated at 33 units per 1000 persons.
In Russia, stainless steel sink per capita consumption expanded at an average annual rate of +5.1% over the period from 2013-2024. In the other countries, the average annual rates were as follows: the United States (-0.1% per year) and Japan (-1.0% per year).
Production
World's Production of Stainless Steel Sinks And Wash Basins
In 2024, production of stainless steel sinks and wash basins decreased by -2.6% to 215M units, falling for the second year in a row after two years of growth. In general, production recorded a noticeable slump. The pace of growth appeared the most rapid in 2017 with an increase of 13% against the previous year. Global production peaked at 361M units in 2014; however, from 2015 to 2024, production stood at a somewhat lower figure.
In value terms, stainless steel sink production expanded slightly to $3.6B in 2024 estimated in export price. Overall, production saw a mild setback. The most prominent rate of growth was recorded in 2014 with an increase of 11% against the previous year. As a result, production reached the peak level of $4.5B. From 2015 to 2024, global production growth remained at a lower figure.
Production By Country
China (76M units) remains the largest stainless steel sink producing country worldwide, comprising approx. 35% of total volume. Moreover, stainless steel sink production in China exceeded the figures recorded by the second-largest producer, Russia (26M units), threefold. The third position in this ranking was held by India (18M units), with an 8.3% share.
From 2013 to 2024, the average annual growth rate of volume in China stood at -5.6%. In the other countries, the average annual rates were as follows: Russia (+7.0% per year) and India (-0.1% per year).
Imports
World's Imports of Stainless Steel Sinks And Wash Basins
In 2024, after two years of decline, there was significant growth in supplies from abroad of stainless steel sinks and wash basins, when their volume increased by 17% to 123M units. In general, imports, however, showed a relatively flat trend pattern. The pace of growth appeared the most rapid in 2021 when imports increased by 21% against the previous year. Global imports peaked at 162M units in 2019; however, from 2020 to 2024, imports remained at a lower figure.
In value terms, stainless steel sink imports totaled $1.4B in 2024. The total import value increased at an average annual rate of +2.3% from 2013 to 2024; however, the trend pattern indicated some noticeable fluctuations being recorded in certain years. The most prominent rate of growth was recorded in 2021 when imports increased by 28%. Over the period under review, global imports hit record highs at $1.6B in 2022; however, from 2023 to 2024, imports remained at a lower figure.
Imports By Country
Malaysia (12M units), Vietnam (9.4M units), the United States (7.3M units), the Philippines (5.3M units), Canada (4.9M units), Russia (4.6M units), Australia (4.6M units), the UK (4.2M units) and Mexico (4M units) represented roughly 46% of total imports in 2024. Saudi Arabia (3.2M units) followed a long way behind the leaders.
From 2013 to 2024, the biggest increases were recorded for the Philippines (with a CAGR of +16.7%), while purchases for the other global leaders experienced more modest paces of growth.
In value terms, the United States ($359M) constitutes the largest market for imported stainless steel sinks and wash basins worldwide, comprising 27% of global imports. The second position in the ranking was held by Vietnam ($81M), with a 6% share of global imports. It was followed by Canada, with a 4% share.
In the United States, stainless steel sink imports expanded at an average annual rate of +5.8% over the period from 2013-2024. The remaining importing countries recorded the following average annual rates of imports growth: Vietnam (+19.7% per year) and Canada (+2.8% per year).
Import Prices By Country
The average stainless steel sink import price stood at $11 per unit in 2024, dropping by -13% against the previous year. Over the period under review, import price indicated a tangible increase from 2013 to 2024: its price increased at an average annual rate of +2.7% over the last eleven-year period. The trend pattern, however, indicated some noticeable fluctuations being recorded throughout the analyzed period. Based on 2024 figures, stainless steel sink import price decreased by -16.7% against 2022 indices. The most prominent rate of growth was recorded in 2020 when the average import price increased by 51% against the previous year. Over the period under review, average import prices reached the maximum at $13 per unit in 2022; however, from 2023 to 2024, import prices stood at a somewhat lower figure.
There were significant differences in the average prices amongst the major importing countries. In 2024, amid the top importers, the country with the highest price was the United States ($49 per unit), while the Philippines ($2.2 per unit) was amongst the lowest.
From 2013 to 2024, the most notable rate of growth in terms of prices was attained by the United States (+15.4%), while the other global leaders experienced more modest paces of growth.
Exports
World's Exports of Stainless Steel Sinks And Wash Basins
After two years of decline, overseas shipments of stainless steel sinks and wash basins increased by 0.1% to 68M units in 2024. Overall, exports, however, showed a abrupt slump. The most prominent rate of growth was recorded in 2015 when exports increased by 29% against the previous year. Over the period under review, the global exports hit record highs at 190M units in 2013; however, from 2014 to 2024, the exports remained at a lower figure.
In value terms, stainless steel sink exports reduced slightly to $1.9B in 2024. In general, total exports indicated a pronounced increase from 2013 to 2024: its value increased at an average annual rate of +2.4% over the last eleven-year period. The trend pattern, however, indicated some noticeable fluctuations being recorded throughout the analyzed period. Based on 2024 figures, exports decreased by -13.3% against 2022 indices. The most prominent rate of growth was recorded in 2021 with an increase of 27% against the previous year. The global exports peaked at $2.2B in 2022; however, from 2023 to 2024, the exports stood at a somewhat lower figure.
Exports By Country
China was the largest exporter of stainless steel sinks and wash basins in the world, with the volume of exports recording 22M units, which was near 33% of total exports in 2024. Malaysia (12M units) held the second position in the ranking, followed by Vietnam (10M units), Turkey (7.2M units) and Mexico (6.5M units). All these countries together held approx. 53% share of total exports. Brazil (1.4M units) followed a long way behind the leaders.
From 2013 to 2024, the most notable rate of growth in terms of shipments, amongst the leading exporting countries, was attained by Vietnam (with a CAGR of +68.4%), while the other global leaders experienced more modest paces of growth.
In value terms, China ($1.2B) remains the largest stainless steel sink supplier worldwide, comprising 65% of global exports. The second position in the ranking was taken by Vietnam ($114M), with a 6.1% share of global exports. It was followed by Mexico, with a 3.3% share.
In China, stainless steel sink exports increased at an average annual rate of +6.8% over the period from 2013-2024. The remaining exporting countries recorded the following average annual rates of exports growth: Vietnam (+66.6% per year) and Mexico (+2.5% per year).
Export Prices By Country
The average stainless steel sink export price stood at $28 per unit in 2024, reducing by -4.3% against the previous year. Overall, the export price, however, posted a prominent expansion. The pace of growth was the most pronounced in 2020 when the average export price increased by 219% against the previous year. The global export price peaked at $30 per unit in 2022; however, from 2023 to 2024, the export prices remained at a lower figure.
There were significant differences in the average prices amongst the major exporting countries. In 2024, amid the top suppliers, the country with the highest price was China ($54 per unit), while Malaysia ($3.7 per unit) was amongst the lowest.
From 2013 to 2024, the most notable rate of growth in terms of prices was attained by China (+21.2%), while the other global leaders experienced more modest paces of growth.
Originally published on INDEXBOX























































.jpg&w=256&q=75)












































.jpg&w=256&q=75)
























.png&w=256&q=75)